Understanding GDP and Economic Growth

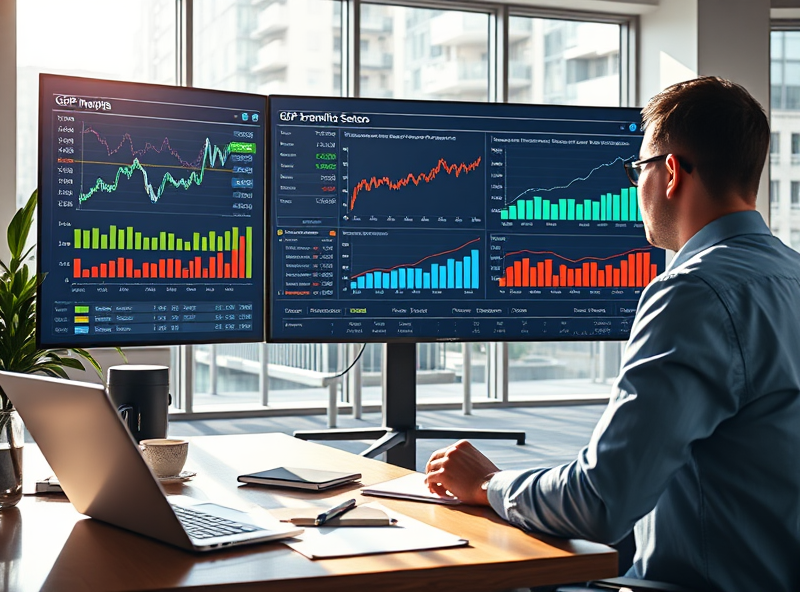
Gross Domestic Product (GDP) is one of the most important indicators to understand the health of a country’s economy. It represents the total monetary value of all goods and services produced within a nation’s borders over a specific time period. When GDP grows, it generally signals a thriving economy, which can lead to higher employment rates, increased consumer spending, and more investment opportunities. However, when GDP contracts, it can indicate economic challenges, such as reduced business activity or higher unemployment.
For smarter investments, understanding GDP trends is crucial. For instance, if GDP growth is steady, it may be a good time to invest in industries that thrive during economic expansion, such as technology or consumer goods. On the other hand, if GDP growth is slowing or contracting, you might consider defensive sectors like healthcare or utilities, which tend to perform better during economic downturns.
Additionally, it’s important to look at GDP in conjunction with other economic indicators, such as inflation and unemployment rates, to get a more comprehensive view of the economy. By staying informed about GDP trends, you can make more strategic decisions that align with the current economic climate.
Inflation Metrics: CPI, PCE, and PPI

When it comes to understanding inflation, three key metrics stand out: the Consumer Price Index (CPI), the Personal Consumption Expenditures (PCE) Price Index, and the Producer Price Index (PPI). Each of these indicators provides unique insights into the economy, helping investors make smarter decisions.
The CPI measures the average change in prices paid by urban consumers for a basket of goods and services. It’s a great tool for understanding how inflation impacts everyday consumers. On the other hand, the PCE Price Index, which is closely monitored by the Federal Reserve, focuses on the changes in prices of goods and services consumed by households. It often provides a broader view of inflation trends compared to the CPI. Lastly, the PPI measures the average change in selling prices received by domestic producers for their output. This indicator is particularly useful for understanding inflationary pressures at the production level, which can eventually trickle down to consumers.
By analyzing these metrics together, investors can gain a more comprehensive understanding of inflation trends, enabling them to make informed decisions about their portfolios. For instance, rising PPI numbers might signal future increases in CPI, giving investors a heads-up on potential shifts in consumer prices. Staying informed about these indicators can help you better navigate the financial markets and protect your investments from inflationary risks.
Employment Trends and Labor Market Insights

When it comes to making smarter investment decisions, understanding employment trends and the labor market is crucial. The labor market serves as a vital indicator of economic health, reflecting how well businesses are performing and how confident consumers feel about their financial future. For instance, when unemployment rates are low, it often signals a strong economy, which can boost consumer spending and corporate profits. On the other hand, rising unemployment may indicate economic slowdown, which could lead to decreased consumer confidence and spending.
Key employment metrics to watch include the unemployment rate, job creation numbers, and labor force participation rate. For example, a rising labor force participation rate often signals that more people are optimistic about finding work, which is a positive sign for the economy. Additionally, wage growth trends can provide insights into inflationary pressures, which may influence Federal Reserve policies and, consequently, the stock and bond markets.
By keeping an eye on these employment indicators, investors can better predict market trends and adjust their portfolios accordingly. Whether you’re investing in stocks, bonds, or real estate, understanding labor market dynamics can help you make more informed and strategic decisions.
Leading Indicators: Building Permits and Construction Trends

When it comes to making smarter investment decisions, understanding leading economic indicators is key. One such indicator is building permits, which provide valuable insights into the health of the construction industry and, by extension, the broader economy. Building permits are issued by local governments and are required before construction can begin on new projects. An increase in building permits typically signals optimism in the economy, as developers are willing to invest in new projects, anticipating future demand. Conversely, a decline in building permits might indicate economic uncertainty or a slowdown in the housing market.
Closely tied to building permits are construction trends, which reflect the pace and scale of ongoing and upcoming projects. For example, a surge in residential construction often points to growing consumer confidence and an expanding housing market. On the other hand, an increase in commercial construction could indicate business growth and a robust job market. By monitoring these trends, investors can gauge economic momentum and identify sectors poised for growth.
To sum up, tracking building permits and construction trends can provide early signals about economic direction, helping you make informed investment choices. Whether you’re eyeing real estate, stocks, or other asset classes, these indicators can serve as a reliable compass for navigating the financial landscape.


